
|
EJS TreeGrid Gantt chart 5.9
Last update:
Thu, 12 March 2009, 10:45:58 pm
Submission date:
Sun, 8 March 2009, 10:25:58 pm
Vote for this product
EJS TreeGrid Gantt chart description
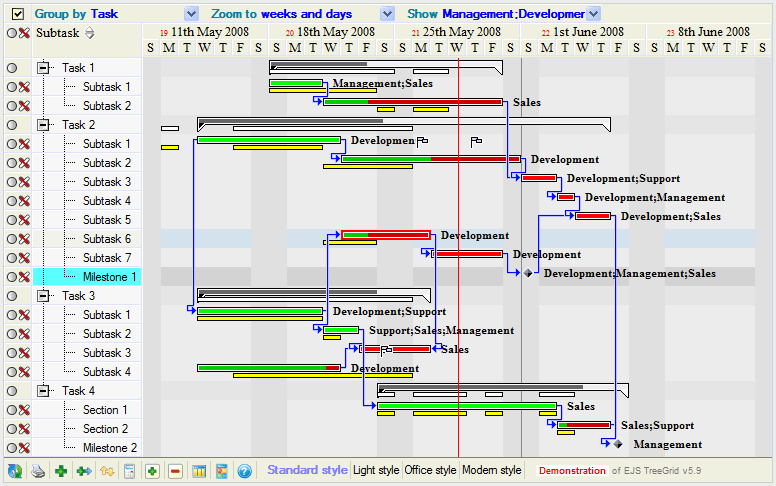
Interactive DHTML Gantt chart by EJS TreeGrid (cross-browser AJAX grid)
Interactive DHTML Gantt chart displayed by Editable JavaScript TreeGrid. The Gantt chart is a JavaScript component and can be fully defined by a developer to display any Gantt chart on HTML page. The developer can define any custom columns and rows to be included in the Gantt - in fact he can create any (tree)grid even without the Gantt. Compatible with Internet Explorer 5.0+, Mozilla 1.0+, Mozilla Firefox 1.0+, Netscape Navigator 6.0+, Opera 7.60+, KHTML (Konqueror 3.0+, Safari 1.2+). The Gantt chart supports all basic and extended Gantt features like in MS Project and more: standard task definition by start date and end date; task percentage completion; real flow definition by (even discrete) date ranges; task dependencies (ss,sf,fs,ff), lines and arrows; milestones (task without length); flags (information); resources (task workers); All the Gantt items can be modified by mouse dragging (e.g. changing dates by moving or resizing bars, adding, changing and deleting dependencies, and so on). Every Gantt data can be also edited in standard grid text/number/date cell or chosen from menu or calendar. Every Gantt cell or item can be calculated by a formula like in MS Excel. Fully customizable zooming - the developer can define various views with specified zoom (from minutes to years) including start and end date limitations and other parameters. Tasks can be grouped by any column values, for example by resource, completion or start date. Tasks can be filtered by any column values, for example by resource or task name. The displayed Gantt chart is also printable. It can display large charts with thousands of rows. EJS TreeGrid supports in the Gantt chart also all extended features like editing, dragging, sorting, filtering, grouping, searching, printing, paging and many more. Uses AJAX or page submit for upload changes to server. Multilanguage, including RTL support for Arabic languages and also Hirji dates. What's new in this release: Interactive Gantt, RTL support, IE8 support Tags: • gantt • chart • gantt chart • ajax • dependency • milestone • flag • resource • flow • zoom • html • asp • net • java • jsp • php • print • sort • filter • search • paging Comments (0)
FAQs (0)
History
Promote
Author
Analytics
Videos (0)
Share this page


• Audio (646)
• Business & Finance (2483) • Desktop Enhancements (296) • Games (392) • Home & Education (770) • Networks & Internet (1298) • Multimedia & Design (556) • Software Development (314) • Utilities (8230) • Web Authoring (255) • eBooks (5) • Graphics (580) Translate with Google


 Related downloads
• HomepageFIX 2020 11.0.1
In 10 Minuten eine eigene Homepage erstellen• HTML fix 1.0.6 WYSIWYG HTML editor• Japplis Website Optimizer 3.0 Reduce the size of your web site.• HTML Guard 3.3.1 Copy protection for websites.• Multiple Text File Edit and Replace 1.1.1 Search and replace text in many files at once• WebExe 1.61 WebExe converts HTML pages into EXE files.More >>> Top downloads in this category
1. HTML Guard 3.3.1
Downloads: 7112. Japplis Website Optimizer 3.0 Downloads: 6133. WebExe 1.61 Downloads: 5994. EJS TreeGrid Gantt chart 5.9 Downloads: 5955. HomepageFIX 2020 11.0.1 Downloads: 5876. Multiple Text File Edit and Replace 1.1.1 Downloads: 5487. HTML fix 1.0.6 Downloads: 526More >>> |
Contact Us | Submit Software | Link to Us | Terms Of Service | Privacy Policy |
Editor Login
InfraDrive Tufoxy.com | hunt your software everywhere.
© 2008 - 2026 InfraDrive, Inc. All Rights Reserved
InfraDrive Tufoxy.com | hunt your software everywhere.
© 2008 - 2026 InfraDrive, Inc. All Rights Reserved