|
Sensor Charts 1.0.3
Last update:
Thu, 1 November 2018, 12:00:03 am
Submission date:
Thu, 1 November 2018, 12:00:03 am
Vote for this product
Sensor Charts description
Sensors data in wonderful charts - Your sensors, your charts
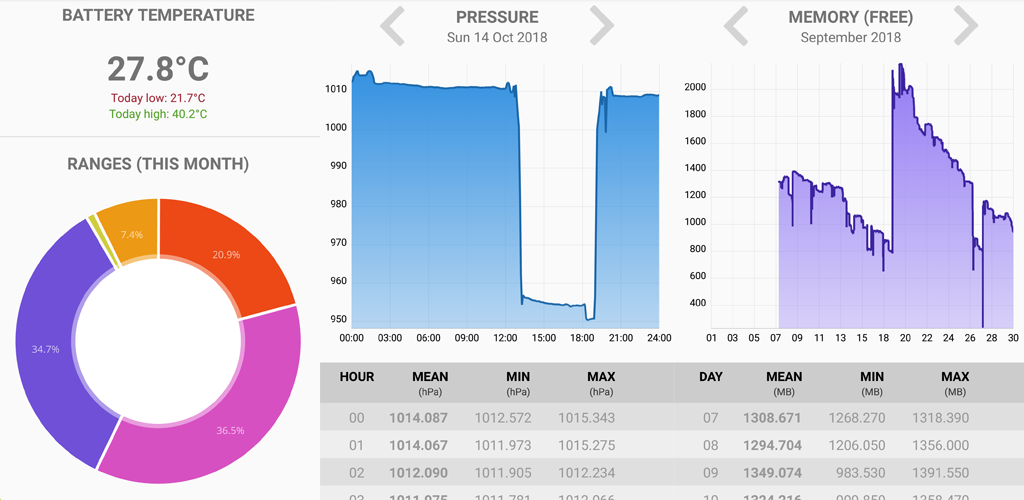
Sensor Charts is a powerful tool able to record automatically in background all sensors data and render it at your command in wonderful and colorful charts. It works from Android 4.4 (Kitkat) to the new Android 9.0 (Pie) It supports a myriad of sensor types*: Pressure Magnetometer Light Battery Battery Temperature Battery Voltage Proximity Memory (Free) RAM (Free) Compass Step Counter Screen Brightness Don't wait any longer: if you don't chart your data, you don't know it for true. Start to know your sensors, you'll love any single chart. Sensor Charts will show you: - time ranges in pie charts (to answer questions like: how long has your screen been turned off in the current month?) - historic data by day and month in linear charts. You can zoom on charts with two fingers and check when your battery left you or when it was discharging very fast. And you'll be able to discover more and more: the only limit is just your immagination. *N.B.: Available sensors depend on their actual presence on your device. Requirements: None What's new in this release: Now a cache speeds up the program Comments (0)
FAQs (0)
History
Promote
Author
Analytics
Videos (0)
|
Contact Us | Submit Software | Link to Us | Terms Of Service | Privacy Policy |
Editor Login
InfraDrive Tufoxy.com | hunt your software everywhere.
© 2008 - 2026 InfraDrive, Inc. All Rights Reserved
InfraDrive Tufoxy.com | hunt your software everywhere.
© 2008 - 2026 InfraDrive, Inc. All Rights Reserved


